What do you actually want from
Troy School District?
Four questions, in your own words. Your answers come to me, a Troy resident — not to the District — and I'll publish what I learn. The questions are right below; the District's own budget documents are at the foot of the page if you want them.
Why I'm asking, and what I'm putting behind it
Turnout for the August 4 school funding vote was 36.6%. The Board's workshop meetings — where policy and strategy are actually argued out, long before anything reaches a vote at a regular meeting — are attended by a handful of residents, in a district of roughly 12,000 students. Decisions worth tens of millions of dollars are being made in near-silence. I'd like to change that a little, and I'm willing to pay for the privilege of your attention: a $100 Amazon gift card drawn at random from everyone who leaves contact details, and $500 to the Troy Foundation for Educational Excellence regardless of what the responses say. Both explained at the foot of the page.
Aggregate results go up on this site after the survey closes and go to the Board of Education. Your actual words are only passed on if you tick a box — off by default — and your contact details are never published or shared either way.
Closing 12 days before the election is deliberate. The results are meant to inform how people think about the District, not to land as an October surprise with no time to argue with it.
The material behind these questions
Everything below is the District's own — its budget, its list of proposed cuts, its Schools of Choice deck — plus the arithmetic I did on top of it. It's collapsed because you shouldn't have to read a budget to answer a question about your kids' school. Open whatever you're curious about; every figure is sourced and every document is reproduced in full.
Where things stand, in four numbers
Turnout, the deficit, the enrollment trend, and the District's own three scenarios.
You don't need any of this to answer questions 1 and 2. It's here because question 3 asks you about specific decisions, and you should be able to see them.
Oakland County voters rejected the Oakland Schools regional enhancement millage — 1.5 mills for six years — by 6,703 votes: 163,120 yes (48.99%) to 169,823 no (51.01%), all 395 precincts reporting. In the City of Troy the margin was wider: 8,821 yes (42.91%) to 11,736 no (57.09%).
Troy School District had built $8,100,000 a year of enhancement millage revenue into two of the three four-year scenarios it showed the Board on July 22. Those two scenarios are now off the table. The remaining one — Scenario 1 — is the plan.
The District's own three scenarios
Presented to the Board of Education, July 22, 2026. Fund balance as a percentage of expenditures is the District's headline solvency measure; the Board's informal floor has been in the mid-teens.
| Scenario | Reductions FY27 / 28 / 29 | FY26 | FY27 | FY28 | FY29 |
|---|---|---|---|---|---|
| 1 — No millage (what happened) | $12M / $7M / $7M | 13.52% | 14.42% | 13.96% | 14.03% |
| 2 — Millage passes | $12M / $7M / $7M | 13.52% | 18.61% | 18.27% | 18.48% |
| 3 — Millage passes, smaller cuts | $12M / $3M / $3M | 13.52% | 18.61% | 15.88% | 16.07% |
Read together: the millage was never the difference between cutting and not cutting in FY27 — $12 million comes out either way. What it bought was the ability to cut $3 million instead of $7 million in each of the two years after that, and a fund balance in the 18s instead of the 14s.
General Fund Scenarios, 4-year — Board of Education, July 22, 2026
3a. The budget the Board adopted
What the Board adopted for FY2027, what it assumes, and the tax rates that go with it.
Adopted June 16, 2026 for the fiscal year that began July 1. The General Fund is the operating budget — salaries, benefits, instruction, buildings, buses. It is separate from the bond and sinking fund money that pays for construction, which by law cannot be spent on operations.
| FY2026 original | FY2026 amend. #3 | FY2027 proposed | |
|---|---|---|---|
| Revenue | $190,545,984 | $202,153,044 | $191,055,509 |
| Expenditures | $194,285,613 | $207,641,522 | $193,342,088 |
| Change in fund balance | $(3,739,629) | $(5,488,478) | $(2,286,579) |
| Beginning fund balance | $32,979,691 | $33,713,795 | $28,225,317 |
| Ending fund balance | $29,240,062 | $28,225,317 | $25,938,738 |
| As % of expenditures | 15.05% | 13.59% | 13.42% |
What the FY2027 budget assumes
- 11,869 blended FTE students, down from 12,069 — a loss of 200 students.
- The lowest per-pupil increase among the Governor's, House's and Senate's proposals — $250 — and the lowest figure proposed for each categorical grant. Budgeting to the floor of the range is a deliberately conservative choice.
- $12,000,000 of expenditure reductions, already netted into the $193.3M expenditure line. Without them the number would be $205.3M.
Michigan's FY2026-27 school aid budget was signed on July 21, 2026 at a $10,300 per-pupil basic foundation allowance. By the District's July 22 scenario sheet, final state revenue is $193,155,509 — about $2.1 million more than the June assumption. That turns the projected FY2027 fund balance change from −$2,286,579 into −$186,579: very close to break-even, after the $12M of cuts.
The tax rates that go with it
Levied for 2026-27. Only the hold-harmless rate moves with the District's own decisions; the rest are fixed by statute or by voter-approved debt.
| Levy | Mills | Falls on |
|---|---|---|
| Operating | 18.0000 | Non-homestead property |
| Commercial personal property | 8.4102 | Business equipment |
| Hold harmless | 2.4102 | Homestead (down from 2.5796 and 2.7294) |
| Debt retirement | 6.1000 | All property — bond repayment |
| Sinking fund | 0.9473 | All property — capital repair |
Hold harmless is the mechanism that matters for question 3c. Troy is one of a minority of Michigan districts allowed to levy a local homestead tax on top of the state foundation allowance, because it was spending above the state formula when Proposal A passed in 1994. It is why Troy's per-pupil foundation allowance is $11,086 in FY2027 while the state basic is $10,300.
Budget Amendment #3 and FY2027 Proposed Budget — June 16, 2026
FY2027 Budget Adoption Resolutions — June 16, 2026
3b. The $12 million in cost reductions
All 37 proposals, with the scores and tiers the administration gave them.
On June 1, 2026 the administration gave the Board a document titled Budget Reduction Scenario, marked "DOCUMENT IS IN PROGRESS." It contains 37 proposals, each scored against six weighted criteria and sorted into three tiers. Everything in this section comes out of that document, reproduced in full.
Where the money comes from
How the proposals were scored
Each proposal was rated 1–5 on six criteria; the weighted total sets its tier. A 5 means minimal negative impact, high feasibility, broad support; a 1 means severe impact or legal risk and widespread opposition.
| Criterion | Weight | What a high score means |
|---|---|---|
| Impact on student learning | 30% | Minimal disruption to core learning |
| Equity impact | 20% | Does not fall disproportionately on high-need students |
| Legal / compliance risk | 15% | Complies with law, policy and labor agreements |
| Cost savings amount | 15% | Substantial, recurring savings |
| Feasibility / timeline | 10% | Can be done in time with existing capacity |
| Stakeholder support | 10% | Staff and families will understand it |
| Tier | Score | Savings | Share | Meaning |
|---|---|---|---|---|
| Tier 1 — Strong candidate | 4.0–5.0 | $8,909,725 | 76.5% | Recommended for inclusion |
| Tier 2 — Consider | 3.0–3.9 | $2,094,526 | 18.0% | Needs planning or phasing |
| Tier 3 — High risk | below 3.0 | $635,100 | 5.5% | Needs further study or redesign |
Every proposal on the list
Click a column heading to sort. This is the detailed proposal list from the June 1 document, transcribed verbatim, with each area's savings reconciled against the document's own summary table.
The document's summary counts 37 proposals and lists 5 under Secondary. Its detailed list contains 36, with 4 under Secondary. Every dollar figure still reconciles — Secondary's four line items sum to exactly the $1,687,800 the summary reports, and all 36 sum to $11,639,351 — so a proposal appears to be counted in the summary without a row in the detail, or carries no savings. On a document stamped "DOCUMENT IS IN PROGRESS" that is unremarkable, but it is worth knowing that the public list is one item short of the public count.
| Area | Proposal | Savings | Score | Tier |
|---|---|---|---|---|
| Total — 36 itemised | $11,639,351 | 4.32 avg |
"Special education remains one of our highest priorities and largest areas of investment in the district. […] all special education programs will continue to be staffed in alignment with state and county requirements […] These decisions are guided by each student's Individualized Education Program (IEP) and are mandated to comply with all legal and educational standards."
The same document gives the reason it is on the list at all:
| 2018-19 | 2024-25 | Change | |
|---|---|---|---|
| Cost — IEP & non-IEP | $16,744,610 | $29,210,999 | +$12,466,389 (+74%) |
| Students served | 1,332 | 1,367 | +35 (+3%) |
Cost per special education student rose from about $12,571 to about $21,369 in six years. Whether that reflects rising need, a state-driven shift in service delivery, or something the District controls is exactly the kind of thing worth an opinion in the box below.
Budget Reduction Scenario — Board of Education workshop, June 1, 2026
3c. Students from outside Troy — what each one is actually worth
The District calls it Schools of Choice. What the state actually pays, the rule almost nobody mentions, eighteen years of demand, and a calculator you can drive.
This is the part almost nobody has run the numbers on, so I did.
Sections 105 and 105c of Michigan's State School Aid Act let a district enroll students who live somewhere else and count them in its own membership, without the home district's permission. Section 105 covers students from other districts inside Oakland County. Section 105c covers students from districts in a neighboring county's ISD — Macomb, Wayne, Livingston, Genesee, Lapeer, Washtenaw. Participation is entirely voluntary, decided by the Board every year, and the District chooses the grades, the buildings, and the number of seats.
Per the Michigan Department of Education: "School districts that enroll nonresident students under Section 105 or 105c receive the lesser of their own foundation allowance or the foundation allowance of the district of residence."
Troy's FY2027 foundation allowance is $11,086, because Troy is a hold-harmless district. The state basic allowance — what most Oakland County districts get — is $10,300. So for a choice student from an at-basic district, Troy receives $10,300, not $11,086. Every Schools of Choice student is worth $786 less than a Troy resident sitting in the same chair.
That is a 7.1% haircut. It does not make the students unprofitable — it makes them about 93 cents on the dollar. Any estimate that multiplies students by $11,086 is too high by roughly $786 apiece, which at 1,200 students is $943,000 a year of revenue that was never there.
What Troy does today
Troy runs what the resolutions call a "Limited" program: a fixed number of seats, only at entry grades. For 2026-27 the Board authorized 116 seats on December 16, 2025 — and only in kindergarten, first grade, and grades 6–8. No high school seats. Several buildings have been closed to open enrollment outright in past years: Barnard, Bemis, Schroeder, Boulan Park, Athens and Troy High.
| Grade | §105 (in county) | §105c (contiguous ISD) | Total |
|---|---|---|---|
| Kindergarten | 83 | 4 | 87 |
| First grade | 25 | 1 | 26 |
| Grades 6–8 combined | 2 | 1 | 3 |
| Total | 110 | 6 | 116 |
In 2025-26 there were 173 Schools of Choice students in Troy's elementary buildings — 3.54% of elementary enrollment. The concentration is uneven: Hill Elementary is at 10.57%, Wass at 6.35%, Wattles at 5.54%; Schroeder is at 0.00% and Bemis at 0.24%.
Eighteen years of demand
Table view — the same data
| Year | Kdg. seats | Kdg. applications | Kdg. enrolled |
|---|---|---|---|
| Total | 1,114 | 2,300 | 1,103 |
Who choice students are
2025-26, elementary buildings. This matters because it is the cost side of the ledger, and because it is a fair question whether the District should be thinking about these students as revenue at all.
| Choice students | Resident students | Difference | |
|---|---|---|---|
| Free / reduced lunch | 54.34% | 28.91% | +25.4 pts |
| Special education | 19.65% | 13.87% | +5.8 pts |
| English learners | 10.98% | 24.92% | −13.9 pts |
The special education gap is the one with a price tag. Troy spends about $21,369 per special education student against a district-wide General Fund average of about $16,290 — a gap of roughly $5,079. An extra 5.8 percentage points of special education share therefore costs on the order of $294 per choice student. The higher free/reduced-lunch share cuts the other way: it draws additional Section 31a at-risk funding. The lower English-learner share reduces EL service cost. Net, the demographic mix is worth a few hundred dollars per student — real, but an order of magnitude smaller than the $786 foundation haircut.
Run the numbers yourself
Defaults are set to the District's own figures and to the premise in question 3 — about 1,100–1,300 students, or roughly 10% of enrollment. Move anything you disagree with.
| Gross foundation revenue | — |
| New sections needed | — |
| Extra support cost | — |
| Net per year | — |
It takes years, not months. Choice students enter at kindergarten and, by statute, may stay until they graduate. Filling every one of the 116 authorized seats every year builds toward the target one grade at a time — see the ramp below. Nothing here helps with the $12 million due in FY2027.
You cannot un-enroll them. A student admitted under §105 or §105c has the right to remain through graduation, and their siblings get first claim on future seats. This is a thirteen-year commitment made one year at a time.
The ramp, year by year
| Year | Cumulative choice students | Gross revenue | Net contribution |
|---|
At the District's own authorization of 116 seats a year, held to graduation across thirteen grades, the steady-state population is roughly 1,200–1,500 students — which is where the "10% of enrollment, 1,100–1,300 students" figure comes from. It checks out. At $10,300 apiece that is $12.4 million a year gross and, on the default assumptions above, about $8.8 million net — coincidentally almost exactly the $8.1 million the enhancement millage would have raised.
But it arrives over about a decade, only if every seat fills every year, and only if the applications show up. In 2025-26 Troy advertised 52 kindergarten seats, received 59 applications, and enrolled 37. Getting to 116 filled seats a year — let alone more — means opening grades and buildings that are currently closed, and competing for families the District has not historically courted.
That is the actual question: not whether the money is real — it is — but whether Troy wants to be a district that recruits.
Schools of Choice Recommendations for 2026-27 — Board workshop, December 9, 2025
One caveat I want to be straight about. Troy's hold-harmless levy is recalculated every year from enrollment, taxable values and the foundation allowance. How adding several hundred nonresident students — who generate the lower allowance — interacts with that calculation is a question for the District's business office, and I have not been able to resolve it from public documents. It could move the per-student figure in either direction. Everything else on this page is straight out of the sources listed at the bottom.
The gift card, the $500, and the fine print
Gift card rules, the $500 match and the filing behind it, and what happens to your answers.
$100 Amazon.com gift card drawing
- No purchase or payment of any kind is necessary.
- How to enter: submit a response to this survey with contact information and a verified mobile number, on or before 11:59 p.m. Eastern on Thursday, October 22, 2026. One entry per person — the verified number is how that is enforced. Answering the questions needs neither.
- Eligibility: 18 or older and a resident of Michigan. Employees and Board members of Troy School District are welcome to respond to the survey but are not eligible for the drawing.
- The drawing: one winner, selected at random from all eligible entries, on or about Monday, October 26, 2026. Odds depend on the number of entries. The winner is notified using the contact information they left, and has 14 days to respond before an alternate is drawn.
- Prize: one $100 Amazon.com gift card. No substitution or cash equivalent. Any tax is the winner's responsibility. The winner's name is not published unless they say it's fine.
- Sponsor: Alex Karpowitsch, Troy, Michigan — personally, and at my own expense. Amazon is not a sponsor of, and has no involvement in, this drawing.
- If you don't want to be entered, leave the contact box blank, or write "no drawing" in it. Your answers still count.
The $500 to the Troy Foundation for Educational Excellence
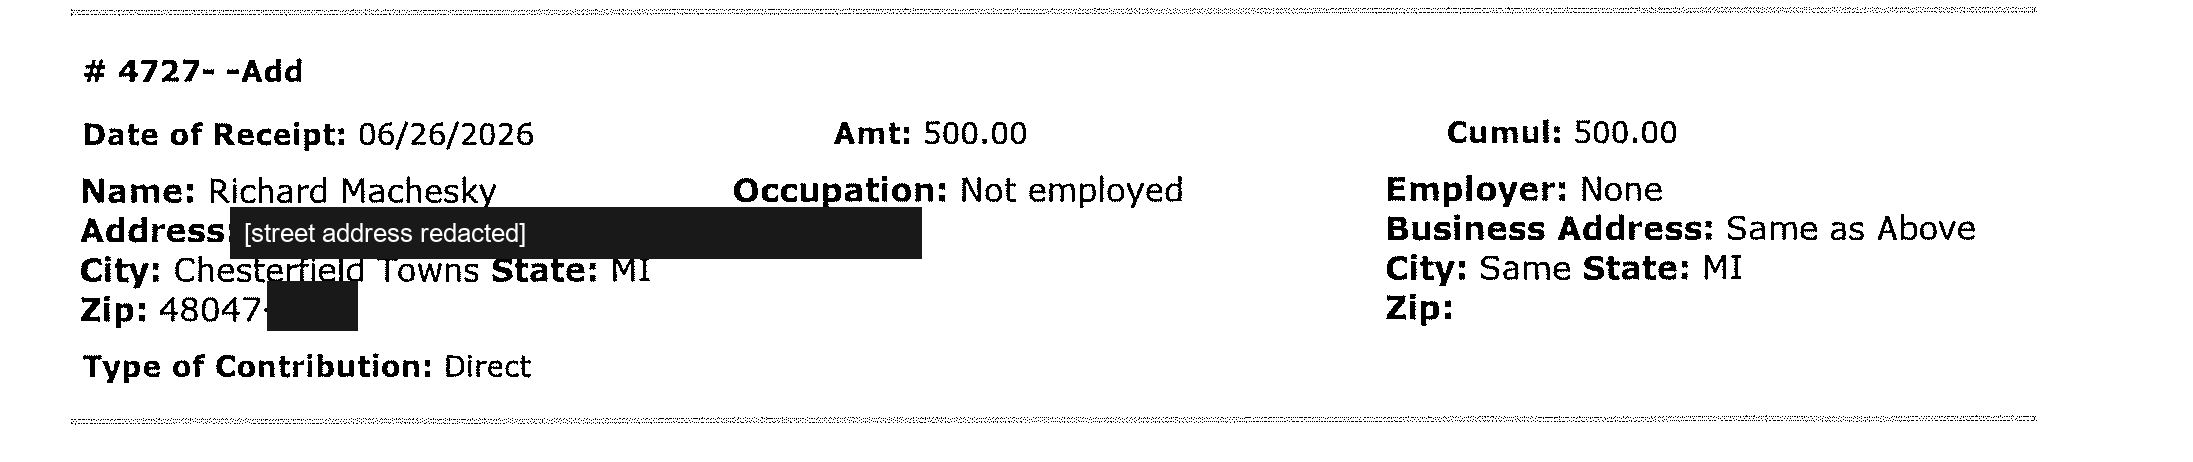
The committee behind the Yes campaign reported a $500 contribution from Richard Machesky, received June 26, 2026. Troy's Superintendent is Dr. Richard M. Machesky — though the filing lists this contributor as "not employed" at a Chesterfield Township address, so the record is below and you can judge it for yourself.
I am matching it. $500 of my own to the Troy Foundation for Educational Excellence, a 501(c)(3) that funds classroom grants for Troy students. It isn't contingent on anything — not on how many responses come in, or what they say — and I'll post the receipt here when it's made.
What happens to your answers
- Answers are stored on Cloudflare infrastructure and are readable only by me.
- Your IP address is recorded with your response. It's the ordinary thing a web form sees, and I keep it for two reasons: to stop one person submitting a hundred times, and to check that responses are genuinely coming from this area rather than from wherever the internet felt like sending them. It is never published, never shared with the District or anyone else, and never shown in any write-up. If that's a dealbreaker, a library or a phone on cellular data will show a different address, and your answers count exactly the same.
- After the survey closes I'll publish an aggregated, anonymized write-up on this site and send it to the Board of Education.
- Your words are passed to board candidates or the District only if you ticked the sharing box, and only with identifying details removed. Left blank, your response is counted in the totals and read by me, and goes no further.
- Contact information is never published, sold, or shared — including with the District — regardless of that box.
- Changed your mind, either direction? Email me and I'll act on it.
- Want your response deleted? Email the address below with enough detail to find it and I'll remove it.